
Interview with Etienne Bossu, Chief Trading Officer at Electrum


October 15, 2024
Reading time : 10 min
Despite significant geopolitical and economic turbulence, implied volatility across asset classes has lately remained subdued. In Gold, volatility spikes have been quickly sold off, reflecting market resilience and a condescension to new emerging risks. This creates potential opportunities to gain exposure to Volatility Premium, which is currently trading at soft levels. The analysis of the volatility skew reflects a fair alignment with the average levels of Calls over. Both volatility and skew remain reasonably priced, despite strong macro conditions that could lead to a high realized volatility environment.
Cross asset vol dynamics in the new trading environment
A range of global economic, geopolitical, and policy risks has contributed to a heightened perception of volatility in financial markets. Factors such as inflationary pressures, central bank monetary tightening, and geopolitical tensions have all played a role in driving uncertainty. However, despite these challenges, markets have not significantly repriced general levels of implied volatility.
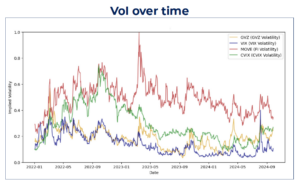
Our analysis is conducted on traditional volatility indices such as GVZ (Gold), VIX (Equity), MOVE (U.S. Rates Swaps) and CVIX (FX). We normalized the time series and observed that they currently trade in the lower band of the range since 2008. Recent volatility peaks failed to revisit the 2022 highs. Bar the VIXs’ spike in late August 2024 caused by a significant miss in U.S. NFP.
These indices are collectively not trading far from their long-term median values. Without any surprise, Rates volatility, as evidenced by the MOVE index, stands as the most volatile asset class given the uncertainty around monetary paths in the U.S. It has been more than a decade since the MOVE index has last taken the crown of the most volatile asset class. On the contrary, VIX prints as the lowest asset class, echoing an observation already made during the 2011-2018 period. Throughout that time, much like today, the S&P 500 experienced a bull run driven by steady growth in the U.S. economy, the normalization of monetary policy, and a complacent «buy the dip» mindset. Notable was the magnitude of the FX implied volatility upside trend from early 2022. This was caused by the start of the hiking cycle by multiple central banks, notably the FED in March 2022, that prompted a strong risk aversion sentiment. For the identical reason, the MOVE index appreciated in the same period but with greater significance. GVZ is the only index holding the 2023 levels following a solid positive growth from the beginning of 2024. The increase in volatility can be attributed to multiple reasons, including a flight to quality impelled by doubts about the U.S. soft landing scenario and a strong central bank demand for the yellow metal.
Identifying Opportunities in Gold Vol
This overall volatility portrait might seem surprising when considering the dramatic trends across various asset classes over the past two years. Particularly, Gold has garnered attention due to a year-to-date surge of over 25% in value. Despite displaying one of the wildest yearly spot returns on record, Gold’s implied volatility has remained relatively muted, mirroring the dynamics seen in Equities.
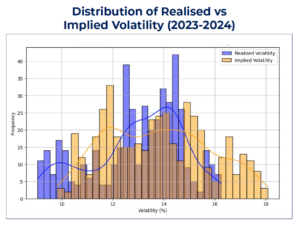
Looking more closely at the past two years and using 3-month ATM volatility as a proxy, a clear pattern emerges. For most of this period, Gold’s implied volatility has consistently traded higher than its realized volatility. However, an exception occurred between late April and the end of July 2024, when Gold consolidated within the $2,300 to $2,400 range, causing implied volatility to align more closely with the realized volatility. This period of consolidation has marked a temporary pause in the otherwise positive volatility premium seen throughout the market. On average over the last 2 years, the volatility premium traded around 0.8%.

The positive average volatility premium reflected the exogenous shock in the Middle East and the consensus mispricing of the Fed’s monetary policy. As a consequence, the market began to assign a significantly larger weight to extreme outcomes (i.e. weight in the right tail of the distribution) in implied versus realized volatility.
Currently, the volatility premium is trading flat to negative and lies in the bottom 25th centile whereas the 2023-2024 mean would sit in the 41st centile of the distribution. Overall, this might suggest that market participants are becoming more resilient to the aforementioned risk events.
Similarly, this might indicate that new incremental risks factored in by markets have only a marginal impact on volatility pricing. Volatility premium appears to be trading at an appealing level. This perspective is also supported by fundamentals such as the uncertainty over the pace and potential escalation of the Middle East conflict, upcoming U.S. elections, a small but considerable probability of U.S. recession and Gold’s long positioning at close to a record high.
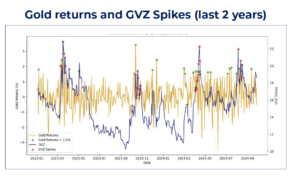
Nonetheless, the resilience of the market towards new vol events seems consistent even when looking at volatility spikes, defined as a value exceeding 2 times the rolling 90-period moving average of GVZ. The number of pins that occurred in the past 3 years falls a little short of the mean per year since 2008, thus pointing to a currently modest variance environment.
Moreover, of the 32 spikes that occurred over the past two years, more than 60% have been sold immediately or shortly after. We identify natural faders of vol such as gold producers, who might be seeking to generate hedging outperformance relative to forwards, or private banks that, on behalf of their clients who are naturally long Gold, sell covered Calls taking advantage of attractive volatility and spot entry points.
Over the last two years, the GVZ spikes concurred with higher spot movements, mostly when the yellow metal did a >1.5% return daily. However, while higher vol was associated with solid positive spot return, the opposite cannot be affirmed. The relationship between the two is a compelling case for analysis with empirical studies often struggling to produce actionable insights.
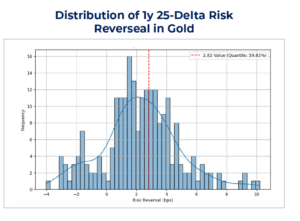
 Although some selling has occurred during volatility spikes, the Skew — measured by the 1-year 25 Delta Call Risk Reversal — currently trades 2.82 Call over. While this Skew level is consistent with Gold’s year-to-date price action, it is noteworthy that it sits around the 60th centile of the monthly data distribution since 2006. This indicates that, historically, the current skew is not particularly elevated.
Therefore, it appears the volatility premium in outright vanilla options is not excessively costly at the moment.
Interview with Etienne Bossu, Chief Trading Officer at Electrum

Etienne Bossu, Chief Trading Officer at Electrum, talks to Véronique Riches-Flores, independent macroeconomist and former Chief Economist at SG CIB, about the global economic outlook and the new market paradigm. […]

EU Carbon Market 101The European Union Emissions Trading Scheme (EU ETS) is based on a cap-and-trade system: Operators of installations including power generation, various industries and intra-European aviation covered by […]